Paramount Group, Inc. | REIT Profile
Symbol: PGRE
CIK: 1605607
Exchange: NYSE
Founded: 2014 (11 years)
HQ: New York, NY, United States
Type of REIT: Equity REIT
Listing Status: Public
Market Capitalization: Small-Cap
REIT Sector: Office
See PGRE on Yahoo Finance
See PGRE on SEC.gov
Paramount Group, Inc. is a real estate investment and management firm with in-house expertise in asset management, property management, leasing, acquisition, repositioning, redevelopment and financing. Established in 1978 by Werner Otto, Paramount is one of the largest publicly-owned real estate companies headquartered in New York City. Over several decades and numerous market cycles, Paramount has provided first class properties, services and amenities to its tenants. Albert Behler, President and CEO, has led Paramount since 1991 and, along with a seasoned, committed and proven management team, has assembled the company's current 11.9 million-square-foot portfolio of high quality, Class A office building investments, a retail property, as well as debt and equity investments in New York, Washington, D.C. and San Francisco.
Stock Chart
REITMovers
REITMovers tracks the stock price and other indicators for all US REITs tracked by REITNotes during normal trading hours. This data is updated every 4 minutes during normal trading hours. Note: All prices have a 15 minute delay.
| Latest Price | High | Low | Open | Previous Close | Volume | Change $ | Change % |
|---|---|---|---|---|---|---|---|
| $4.31 | $4.37 | $4.27 | $4.33 | $4.35 | 3,485,993 | -$0.04 | -0.92% |
Last update: 2025-04-25 12:58:59 PST
REITRating™ Trend
REITRating™ is REITNotes' Real Estate Investment Trust industry-specific rating and ranking system. The overall score is out of ten points, with ten being the best score. See score breakdown. The graph below plots the overall REITRating™ score for the last trading days. See complete trend.
Dividend of Trading Day 2025-04-25
Annualized Dividend: $0.14*
Dividend Yield (TTM): 3.2%
Annualized Dividend (TTM): $0.14
Ex-Dividend Date: 2024-06-28
Dividend Date: 2024-07-15
Dividend Frequency: Quarterly
*The forward annualized dividend and dividend yield are based on the most recent dividend value paid by the REIT. The REIT may have already announced their next upcoming dividend value, which may be different from previously paid dividend value. It is recommended to check the REIT's website and dividend announcements for the latest information on upcoming dividends and changes. This graph does not include extraordinary dividend.
Latest REIT Press Releases
- Paramount Group, Inc. - Paramount Declares Quarterly Cash Dividend - Thu, 15 Jun 2023 12:01:05 UTC
- Paramount Group, Inc. - Paramount Announces First Quarter 2023 Results - Wed, 03 May 2023 20:16:29 UTC
- Paramount Group, Inc. - Paramount Announces Release Date for First Quarter 2023 Results - Wed, 12 Apr 2023 12:00:56 UTC
- Paramount Group, Inc. - Paramount Signs 119,000 Square Foot Lease at 31 West 52nd Street in New York - Mon, 03 Apr 2023 12:01:26 UTC
- Paramount Group, Inc. - Paramount Declares Regular Quarterly Dividend - Wed, 15 Mar 2023 12:02:19 UTC
Funds From Operations (FFO)
FFO Amount and Payout Ratio
Below are the FFO amounts, dividends, and payout ratios for the last two quarters for PGRE.
| Year | Quarter | Type | Amount | Dividend Paid | Payout Ratio |
|---|---|---|---|---|---|
| 2024 | Q4 | FFO | $--- | $--- | ---% |
| 2024 | Q4 | FFO Core | $--- | $--- | ---% |
| 2024 | Q3 | FFO Core | $--- | $--- | ---% |
| 2024 | Q3 | FFO | $--- | $--- | ---% |
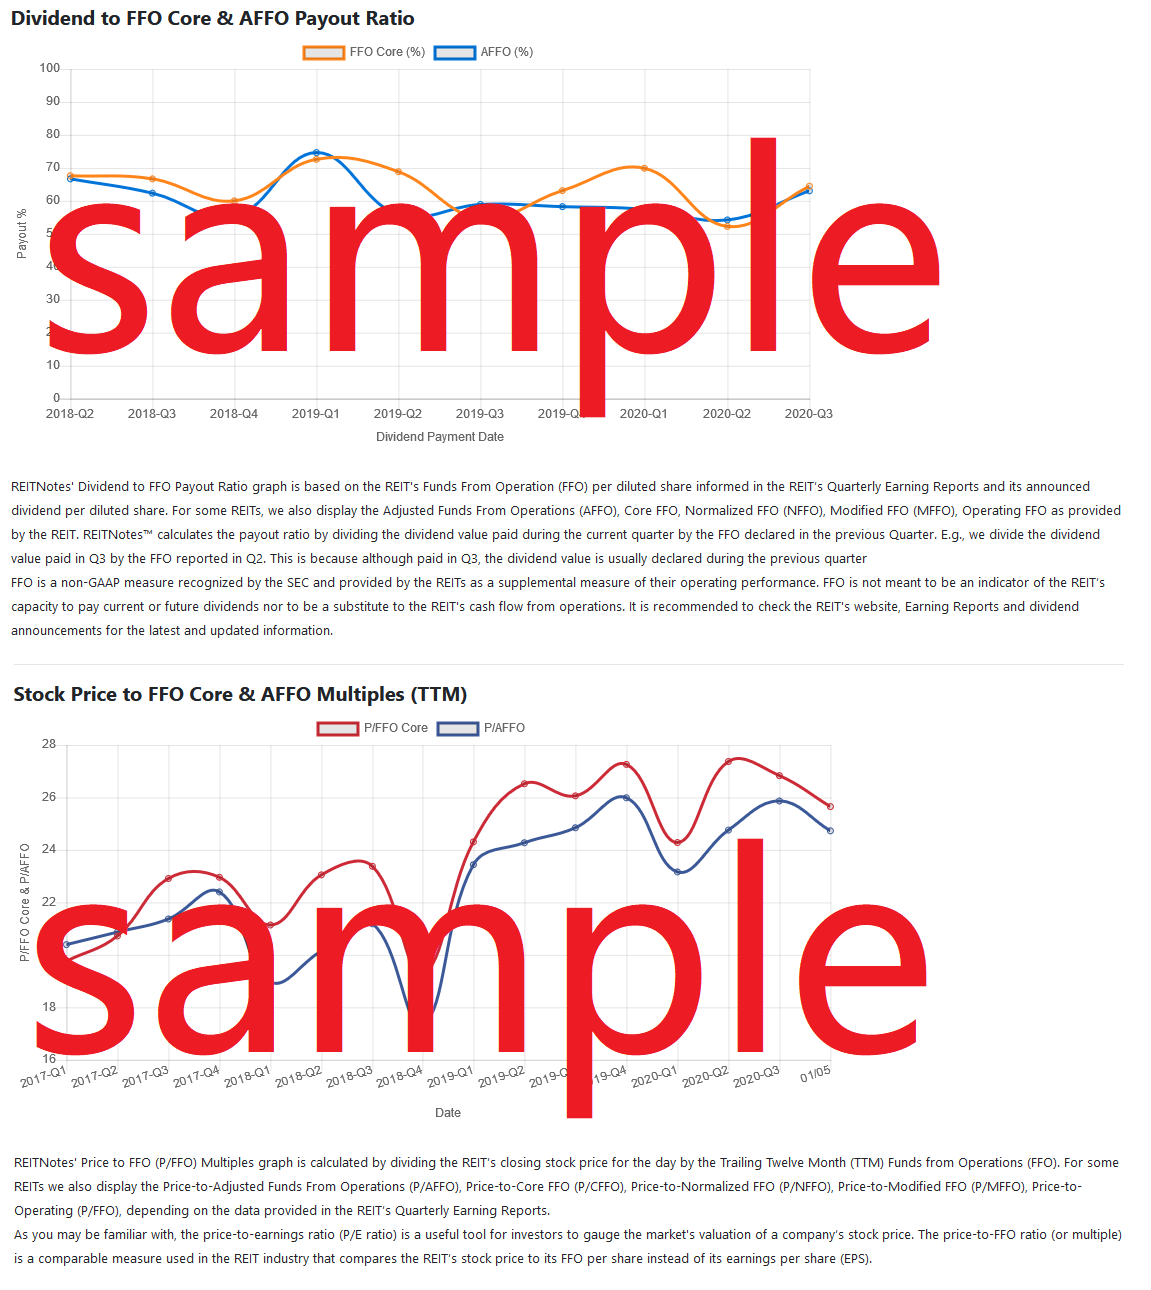
REITNotes uses the REIT's Funds From Operation (FFO) per diluted share informed in the REIT’s Quarterly Earning Reports and its announced dividend per diluted share. For some REITs, we also display the Adjusted Funds From Operations (AFFO), Core FFO, Normalized FFO (NFFO), Modified FFO (MFFO), Operating FFO as provided by the REIT. REITNotes™ calculates the payout ratio by dividing the dividend value paid during the current quarter by the FFO declared in the previous Quarter. E.g., we divide the dividend value paid in Q3 by the FFO reported in Q2. This is because although paid in Q3, the dividend value is usually declared during the previous quarter. FFO is a non-GAAP measure recognized by the SEC and provided by the REITs as a supplemental measure of their operating performance. FFO is not meant to be an indicator of the REIT’s capacity to pay current or future dividends nor to be a substitute to the REIT's cash flow from operations. It is recommended to check the REIT's website, Earning Reports and dividend announcements for the latest and updated information.
Key Stats of Trading Day 2025-04-25
EBITDA: $334,929,000
P/E Ratio: N/A
PEG Ratio: 0.53
Book Value: 14.44
Dividend Per Share: $0.07
EPS: -0.21
Revenue Per Share TTM: $3.27
ProfitMargin: -6.50%
Operating Margin TTM: -5.60%
Return on Equity TTM: -1.00%
Revenue TTM: $710,365,000
Gross Profit TTM: $407,087,000
Diluted EPS TTM: $-0.21
Quarterly Earnings Growth YOY: 475.30%
Quarterly Revenue Growth YOY: -26.20%
Trailing P/E: N/A
Forward P/E: N/A
Beta: 1.12
Price to Book Ratio: 0.30
EV to Revenue: 5.61
EV to EBITDA: 11.80x
Shares Outstanding: 219,225,000
52 Week High: $5.47
52 Week Low: $3.75
50 Day Moving Average: $4.29
200 Day Moving Average: $4.76
Properties Owned by PGRE

Sample of REIT’s Properties. Image Source - REIT’s website
Occupancy Rate
REIT Simulation
Below is a simulation of how much money you would have made in dividends, and how much the shares would be worth had you purchased them 1 year ago for the amounts below.
| With $1,000 USD | With $500 USD | With $250 USD | With $100 USD | With $50 USD | |
|---|---|---|---|---|---|
| Initial investment | @ $13.38 per share you would have been able to buy 74 shares of PGRE on 2024-04-25 costing $990.12 | @ $13.38 per share you would have been able to buy 37 shares of PGRE on 2024-04-25 costing $495.06 | @ $13.38 per share you would have been able to buy 18 shares of PGRE on 2024-04-25 costing $240.84 | @ $13.38 per share you would have been able to buy 7 shares of PGRE on 2024-04-25 costing $93.66 | @ $13.38 per share you would have been able to buy 3 shares of PGRE on 2024-04-25 costing $40.14 |
| Current worth | On 2024-07-05 these 74 shares would be worth $345.58 @ $4.67 | On 2024-07-05 these 37 shares would be worth $172.79 @ $4.67 | On 2024-07-05 these 18 shares would be worth $84.06 @ $4.67 | On 2024-07-05 these 7 shares would be worth $32.69 @ $4.67 | On 2024-07-05 these 3 shares would be worth $14.01 @ $4.67 |
| Dividends earned | $2.59 in dividends would have been earned since 2024-04-25 with 74 shares. | $1 in dividends would have been earned since 2024-04-25 with 37 shares. | $0.63 in dividends would have been earned since 2024-04-25 with 18 shares. | $0.25 in dividends would have been earned since 2024-04-25 with 7 shares. | $0.11 in dividends would have been earned since 2024-04-25 with 37 shares. |
| Net (gain / loss)* | -641.95 USD | -320.98 USD | -156.15 USD | -60.73 USD | -26.03 USD |
| ROI** | -64.84% | -64.84% | -64.84% | -64.84% | -64.84% |
*Net (Gains/Loss): Includes the stock price (appreciate or depreciate ) + dividends earned during period held. Stock prices based on closing price for the date. **ROI: Is based on the Net (gain/loss) divided by the initial investment value. Note: Past performance is no guarantee of future results. This is a high-level simulation and does not account for many factors such as inflation and taxes so we cannot guarantee the accuracy of this simulation.
Dividend History
Below are the most recent cash dividends paid by PGRE. The percent difference from one dividend payment to the next has also been calculated for your convenience. Dividends flagged as [E] are extraordinary dividend payments.
| Symbol | Ex Date | Cash Amount | Change in Dividend | Declaration Date | Record Date | Payment Date |
|---|---|---|---|---|---|---|
| PGRE | 2024-06-28 | 0.035 | --- | 2024-06-14 | 2024-06-28 | 2024-07-15 |
| PGRE | 2024-03-27 | 0.035 | --- | 2024-03-15 | 2024-03-28 | 2024-04-15 |
| PGRE | 2023-12-28 | 0.035 | --- | 2023-12-15 | 2023-12-29 | 2024-01-12 |
| PGRE | 2023-09-28 | 0.035 | --- | 2023-09-15 | 2023-09-29 | 2023-10-13 |
| PGRE | 2023-06-29 | 0.035 | -54.84% | 2023-06-15 | 2023-06-30 | 2023-07-14 |
| PGRE | 2023-03-30 | 0.078 | --- | 2023-03-15 | 2023-03-31 | 2023-04-14 |
| PGRE | 2022-12-29 | 0.078 | --- | 2022-12-15 | 2022-12-30 | 2023-01-13 |
| PGRE | 2022-09-29 | 0.078 | --- | 2022-09-15 | 2022-09-30 | 2022-10-14 |
| PGRE | 2022-06-29 | 0.078 | --- | 2022-06-15 | 2022-06-30 | 2022-07-15 |
| PGRE | 2022-03-30 | 0.078 | 10.71% | 2022-03-15 | 2022-03-31 | 2022-04-15 |
| PGRE | 2021-12-30 | 0.070 | --- | 2021-12-15 | 2021-12-31 | 2022-01-14 |
| PGRE | 2021-09-29 | 0.070 | --- | 2021-09-15 | 2021-09-30 | 2021-10-15 |
| PGRE | 2021-06-29 | 0.070 | --- | 2021-06-15 | 2021-06-30 | 2021-07-15 |
| PGRE | 2021-03-30 | 0.070 | --- | 2021-03-15 | 2021-03-31 | 2021-04-15 |
| PGRE | 2020-12-30 | 0.070 | -30.00% | 2020-12-15 | 2020-12-31 | 2021-01-15 |
| PGRE | 2020-09-29 | 0.100 | --- | 2020-09-15 | 2020-09-30 | 2020-10-15 |
| PGRE | 2020-06-29 | 0.100 | --- | 2020-06-15 | 2020-06-30 | 2020-07-15 |
| PGRE | 2020-03-30 | 0.100 | --- | 2020-03-13 | 2020-03-31 | 2020-04-15 |
| PGRE | 2019-12-30 | 0.100 | --- | 2019-12-13 | 2019-12-31 | 2020-01-15 |
| PGRE | 2019-09-27 | 0.100 | --- | 2019-09-13 | 2019-09-30 | 2019-10-15 |
Financial Statements Overview
Balance Sheet | Quarterly
See Annual Balance Sheet | See Quarterly Balance Sheet
| Assets | 2024-12-31 | 2024-09-30 | QoQ |
|---|---|---|---|
| Current Assets | |||
| Cash and Cash Equivalents at Carrying Value | 375,056,000 | 318,725,000 | |
| Short-Term Investments | 0 | 0 | |
| Cash and Short Term Investments | 375,056,000 | 318,725,000 | |
| Current Net Receivables | 0 | 0 | |
| Inventory | 0 | 866,452,000 | |
| Other Current Assets | 180,391,000 | 173,510,000 | |
| Total Current Assets | 930,101,000 | 866,452,000 | 7.3% |
| Non-Current Assets | |||
| Property Plant Equipment | 0 | 0 | |
| Accumulated Depreciation Amortization PPE | 0 | 0 | |
| Long-Term Investments | 90,601,000 | 133,526,000 | |
| Investments | 0 | 0 | |
| Intangible Assets Excluding Goodwill | 0 | 54,125,000 | |
| Goodwill | 0 | 0 | |
| Intangible Assets | 0 | 54,125,000 | |
| Other Non-Current Assets | 0 | 0 | |
| Total Non-Current Assets | 6,941,402,000 | 54,125,000 | 12,724.8% |
| Total Assets | 7,871,503,000 | 7,890,952,000 | -0.2% |
| Liabilities | |||
| Current Liabilities | |||
| Current Accounts Payable | 0 | 0 | |
| Deferred Revenue | 0 | 0 | |
| Current Debt | 0 | 0 | |
| Short-Term Debt | 0 | 0 | |
| Current Long-Term Debt | 0 | 0 | |
| Short Long-Term Debt Total | 3,676,630,000 | 3,674,367,000 | |
| Other Current Liabilities | 0 | -114,808,000 | |
| Total Current Liabilities | 119,881,000 | 114,808,000 | 4.4% |
| Non-Current Liabilities | |||
| Long-Term Debt Noncurrent | 0 | 0 | |
| Long-Term Debt | 3,676,630,000 | 3,674,367,000 | |
| Capital Lease Obligations | 0 | 0 | |
| Other Non-Current Liabilities | 65,495,000 | 50,371,000 | |
| Total Non-Current Liabilities | 3,742,125,000 | 3,724,738,000 | |
| Total Liabilities | 3,862,006,000 | 3,839,546,000 | 0.6% |
| Shareholders' Equity | |||
| Common Stock | 2,175,000 | 2,175,000 | |
| Common Stock Shares Outstanding | 217,335,362 | 217,314,706 | |
| Treasury Stock | 0 | 0 | |
| Retained Earnings | -1,005,627,000 | -966,973,000 | |
| Total Shareholder Equity | 3,141,277,000 | 3,173,867,000 | -1.0% |
Amounts in USD ($)
Income Statement | Quarterly
See Annual Income Statement | See Quarterly Income Statement
| Income Statement | 2024-03-31 | 2023-12-31 | 2023-09-30 | 2023-06-30 |
|---|---|---|---|---|
| Total Revenue | 188,877,000 | 192,471,000 | 189,181,000 | 172,662,000 |
| Cost of Revenue | 0 | 0 | 0 | 0 |
| Gross Profit | 188,877,000 | 192,471,000 | 189,181,000 | 172,662,000 |
| Research and Development | 0 | 0 | 0 | 0 |
| Selling General and Admin | 16,634,000 | 15,679,000 | 15,460,000 | 16,224,000 |
| Operating Expense | 151,055,000 | 425,493,000 | 178,271,000 | 221,038,000 |
| Operating Income | 37,822,000 | -233,022,000 | 10,910,000 | -48,376,000 |
| Income Expense Net (Other) | 0 | 0 | 0 | 0 |
| EBIT | 37,927,000 | -235,705,000 | 10,189,000 | -48,344,000 |
| Interest Income | 33,918,000 | 24,124,000 | 37,549,000 | 35,340,000 |
| Pretax Income | 17,078,000 | -271,425,000 | -24,798,000 | -82,256,000 |
| Income Tax | 347,000 | 302,000 | 263,000 | 573,000 |
| Minority Interest | 6,866,000 | -66,177,000 | -16,676,000 | -35,291,000 |
| Net Income | 9,865,000 | -205,600,000 | -8,385,000 | -47,538,000 |
| Net Income Basic | 9,865,000 | -205,600,000 | -8,385,000 | -47,538,000 |
Amounts in USD ($)
Cash Flow | Quarterly
See Annual Cash Flow | See Quarterly Cash Flow
| Cash Flow | 2024-03-31 | 2023-12-31 | 2023-09-30 | 2023-06-30 |
|---|---|---|---|---|
| Net Income | 9,865,000 | -205,600,000 | -8,385,000 | -47,538,000 |
| Depreciation | 61,114,000 | 68,866,000 | 60,263,000 | 62,627,000 |
| Changes in Receivables | 369,874,000 | 369,262,000 | 361,981,000 | 360,275,000 |
| Changes in Inventories | 0 | 0 | 0 | 0 |
| Cash Change | 276,235,000 | 428,208,000 | 399,631,000 | 434,751,000 |
| Cash Flow | 69,890,000 | 102,262,000 | 37,541,000 | 80,088,000 |
| Capital Expenditures | -39,344,000 | -33,153,000 | -23,063,000 | -25,427,000 |
| Investments | 0 | 0 | 0 | 0 |
| Investing Activity (Other) | 0 | 0 | 0 | 0 |
| Total Investing Cash Flows | -41,248,000 | -53,153,000 | -23,063,000 | -64,999,000 |
| Dividends Paid | 0 | 0 | 0 | 0 |
| Net Borrowings | 3,393,615,000 | 3,375,276,000 | 3,334,477,000 | 3,341,312,000 |
| Cash Flow Financing | -90,230,000 | -10,033,000 | -51,386,000 | -18,633,000 |
| Financing Cash Flows (Other) | 0 | 0 | 0 | 0 |
| Exchange Rate Effect | 0 | 0 | 0 | 0 |
Amounts in USD ($)
REITRating™ Scorecard
| Rating | Dividend Section | Avg. Rating |
|---|---|---|
| 0 | Dividend Payment Growth: Analysis of how the REIT’s dividend payments have performed during the last three years. | 4.9 |
| 9 | Dividend Payment Consistency: Analysis of how many periods the REIT’s dividends have been paid consistently without a gap in payment. | 8.1 |
| Rating | AFFO & Efficiency Section | Avg. Rating |
| 7 | FFO Core Trend: Analysis of the REIT’s FFO Core trend during the last two years. | 8.7 |
| 6 | FFO Core to Revenue Health: Analysis of the REIT's Adjusted Funds From Operation to its Revenues. | 6.8 |
| 1 | Operating Expense Efficiency: Analysis of the REIT's Operating Expenses to its Revenues. | 6.9 |
| 4 | Operating Expense Efficiency Trend: Analysis of the trend of the REIT's Operating Expenses to its Revenue. | 8.2 |
| Rating | Leverage Section | Avg. Rating |
| 10 | Total Debt Interest Rate Competitiveness: Analysis of the REIT’s Interest Rate to Total Debt competitiveness compared to REIT market. | 7.8 |
| 9 | Total Debt Interest Rate Trend: Analysis of the REIT’s Interest Rate to Total Debt trend during the last two years. | 7.3 |
| 6 | Debt Leverage Health: Analysis of the REIT’s Total Debt to Total Assets. | 4.8 |
| 7 | Debt Leverage Health Trend: Analysis of the REIT’s Total Debt to Total Assets over the last two years. | 6.8 |
| Rating | Asset & Revenue Section | Avg. Rating |
| 8 | G&A Effeciency Level: Analysis of the REIT’s General and Administrative expenses in relationship to its Revenues. | 7.6 |
| 8 | G&A Effeciency Trend: Analysis of the Trend of the REIT’s General and Administrative expenses in relationship to its Revenues. | 8.4 |
| 5 | Revenues Growth: Analysis of how the REIT's Revenue has performed over the last two years. | 7.3 |
| 5 | Total Asset Growth: Analysis of how the REIT has grown its Total Assets over the last two years. | 6.4 |
| Rating | Properties Section | Avg. Rating |
| 6 | Occupancy Health Level: Analysis of the REIT’s occupancy health level during the last four quarters. | 7.8 |
| 4 | Occupancy Trend: Analysis of the REIT’s occupancy trend over the last two years. | 7.7 |
| 8 | Tenants: Analysis of the REIT's tenant diversification, operation type, and exposure to risk. | 8.1 |
| Rating | Market Cap Section | Avg. Rating |
| 6 | Market Cap Strength: Analysis of the REIT's Market Capitalization performance, preservation and resistance in comparison to market changes. | 5.1 |
| 5.6 | Overall REITRating™ Score (See trend) | 6.4 |
REITRating is REITNote's Real Estate Investment Trust industry-specific rating and ranking system. The REIT’s score for each analysis is out of ten points, with ten being the best score and zero being the worst. A score of zero can be assigned if the REIT does not meet the criteria for that specific analysis. N/A is assigned if insufficient data is available for a particular analysis. Our REITRating logic is continuously improving, so a REIT’s rating and ranking may change over time. Important Note: REITRating is not a predictor of a REIT’s future performance, it is an evaluation of its past results. Additionally, the REITRating system is for informational purposes only and does not represent financial or investment advice or a recommendation of which REITs to acquire. Learn more.
Related REITs
| REIT | REITRating™ Score | Exchange | Market Capitalization | Sector | Country |
|---|---|---|---|---|---|
| SL Green Realty Corp (SLG) | 6.2 | NYSE | Mid-Cap | Office | United States |
| Hudson Pacific Properties (HPP) | 4.5 | NYSE | Small-Cap | Office Diversified | United States |
| W.P. Carey, Inc. (WPC) | 7.5 | NYSE | Large-Cap | Diversified Industrial Self Storage Office Retail | United States |
| Gaming & Leisure Properties, Inc. (GLPI) | 7.8 | NASDAQ | Large-Cap | Specialty | United States |
Last updated: 2025-04-25 - v5.9